A combination of climate, conflict, and currency values are factors in cost competitiveness that impacts transits and overall U.S. corn exports.
Climate
Climate conditions brought widespread drought to the United States Corn Belt in 2023. Dry conditions in the Mississippi River basin led to record low water levels. As a result, barge weight and traffic restrictions were imposed, and the 7.7 million tons of corn moved by barge on the Mississippi River in 2023 was 30% lower than 2022 and 54% lower than 2021. Ultimately, the cost of added time and weight restrictions were factors contributing to a higher corn price at port but also meant pace of getting grain to the port was slowed.
Climate-induced waterway challenges for U.S. corn don’t end at the Gulf. Extreme drought has forced substantial scaleback of shipping through the Panama Canal, a key global maritime channel. The Panama Canal Authority (ACP) has reduced traffic to 24 ships a day, about two-thirds of the normal traffic, and forecasts that traffic will stay at the current reduced levels for about three more months. That forecast assumes the timely start of the normal rainy season.
Normally, 18% of U.S. corn exports travel through the Panama Canal, which offers the most efficient route from the Gulf ports to Asian nations. Together China and Japan have received about one-quarter of U.S. corn exported to date in the 2023/24 marketing year.
Conflict
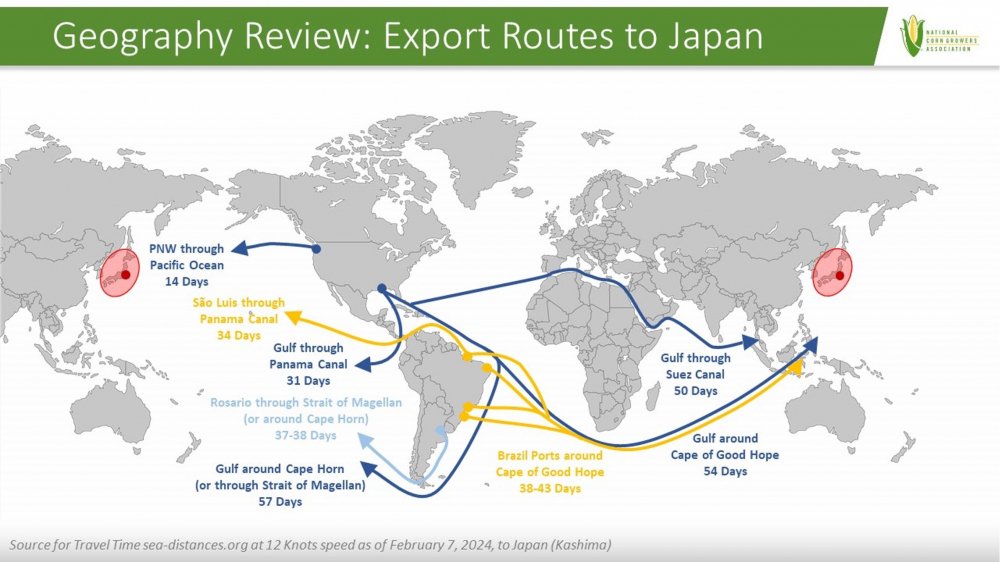
War-related Houthi attacks in the Red Sea impact transits through the Suez Canal, another major global shipping channel. Consider the potential paths to transport corn from the U.S. to Kashima, Japan’s leading port for receiving corn imports. Although the 50-day route through the Suez Canal is considerably longer than 31 days through the Panama Canal, it is the next most efficient pathway to Japan from the U.S. Gulf. Due to a combination of safety considerations and added canal fees, transits in the Suez Canal have dropped. The International Monetary Fund PortWatch considers both canals major chokepoints, each with January 2024 transits 36% lower than January 2023.
The next best alternative pathways are the 54-day trip around the Cape of Good Hope at the southern tip of Africa and the 57-day trip around Cape Horn or through the Strait of Magellan at the southern tip of South America, approaching double the time in transit compared to through the Panama Canal. Alternatively, corn could be shipped from the U.S. Pacific Northwest (PNW) ports with just 14 days transit time. That is effective for corn grown in the northwestern U.S. but moving grain from the Midwest to the PNW has logistic and cost implications.
Although the Panama Canal is the shortest route from Brazil to Japan, grain from Brazil’s ports can reach Japan around the Cape of Good Hope at the southern tip of Africa in about 10 to 15 fewer days as compared to shipments from the U.S. Gulf. Exports from Argentina’s primary grain port have a similar advantage in transit time over the U.S. Those time differences have implications for cost competitiveness.
Currency
The U.S. broad dollar index is a trade-weighted index measuring the value of the U.S. dollar relative to other world currencies. The nominal broad dollar index is well above the long-term average, and the higher average of the last recent ten years. For the past six months, the inflation-adjusted real broad dollar index has been at the highest point of the dataset, aside from the peak in 2022.
When the U.S. dollar value is high relative to foreign currency, U.S. products are less attractive to buyers in other nations. This is an important factor for agriculture commodity export markets. For most of the period from mid-2022 through the end of 2023, the price for U.S. corn was higher than the Brazil price, at times more than $1 higher, partially driven by the strong dollar. Since late 2023, the prices have converged and tracked closer despite the still-strong dollar. That remains a factor, but localized fundamental dynamics of each nation are also coming into play in relative price. In the U.S., farmers just harvested a record corn crop and stocks are plentiful putting downward pressure on price. At the same time, weather threatens Brazil’s corn planted area and production for 2023/24 putting upward pressure on price.
While the current fundamental dynamics are giving the U.S. a lower cost in the world market that has attracted demand, the strong dollar’s negative effect on commodity cost competitiveness will be more evident if the fundamental situation changes. Soybeans provide an example of the alternative fundamental situation; the oilseed is currently about $1.50 per bushel more costly in the U.S. than Brazil. Domestic soybean stocks are tighter than corn, and despite weather challenges, Brazil is still on track to produce a substantial soybean crop.
Summary
The cost competitiveness of U.S. corn and other agricultural commodities has faced a triple whammy from climate, conflict, and currency values. The impact of climate and conflict over the past year has had a greater impact on the U.S. than major export competitor Brazil. At the same time a strong dollar has made it hard to draw demand in the global marketplace. U.S. corn exports were down 33% from 2021/22 to 2022/23. Recent seasonal and supply side differences between the U.S. and Brazil have contributed to a lower U.S. price in recent months that has helped attract demand for U.S. corn from other nations and domestically but at the cost of lower prices for the U.S. corn farmer. The National Corn Growers Association is prioritizing the need for growing demand for U.S. corn that supports use of corn at prices above cost of production for the U.S. corn farmer.